County Concerns:
Table 1: What do you think the following are concerns in the COUNTY? | |||||
Strongly Agree | Agree | Neither Agree nor Disagree | Disagree | Strongly Disagree | |
Alcohol Abuse | 36% | 37% | 23% | 3% | 1% |
Drug Abuse | 35% | 40% | 20% | 3% | 1% |
Access to Healthy Food | 24% | 33% | 28% | 13% | 3% |
Safety-Crime Related | 16% | 40% | 32% | 11% | 1% |
Safety-Design Related (includes adding stop signs, speed limits, crosswalks, or safe walking paths | 21% | 38% | 27% | 12% | 2% |
Emergency Preparedness | 25% | 38% | 29% | 8% | 1% |
Services for the Elderly | 24% | 40% | 31% | 5% | 1% |
Mental Health Services | 18% | 36% | 36% | 9% | 2% |
Environmental-Human Related (includes water quality, industrial wastes, recycling etc.) | 31% | 37% | 20% | 10% | 2% |
Environmental-Nature Related (including preserving rivers, game, forests etc.) | 24% | 36% | 28% | 9% | 3% |
Education Opportunities for Adults | 19% | 34% | 36% | 9% | 2% |
Youth Activities | 29% | 42% | 22% | 5% | 1% |
Animal Control | 27% | 31% | 32% | 8% | 1% |
Opportunities to Exercise for All | 24% | 33% | 27% | 12% | 4% |
Domestic Violence | 22% | 35% | 38% | 4% | 1% |
Availability of Health Services | 27% | 37% | 26% | 9% | 2% |
Preserving our Heritage | 15% | 32% | 44% | 8% | 2% |
Highlighted rows have the most residents Strongly Agreeing, or Agreeing that the topic is of Concern (Table 1).

The top concerns in communities are alcohol abuse, drug abuse, and youth activities (Fig. 1)
* Due to a computer error, environmental-nature related was left off of the online version of the survey. About 1/4 of the surveys were entered online by respondents, and the other surveys were submitted as a paper copy, and then entered online. Only 56 respondents for the whole county listed environmental-nature as one of their top 3 concerns.
County Services:

The most difficult services to get in Jefferson County communities are mental health services and vision care, while the easiest are medical care and dental care (Fig.2).

Emergency medical services, fire protection, and law enforcement are rated the highest in quality.
Walking paths, roads/bridges, and mental health services are rated the worst in quality. (Fig. 3)
Table 2: Was there a time in the last 12 months when any of the following occurred? | ||||
Yes | No | I don’t know | N/A | |
You had difficulty getting a doctor's appointment, or appointment with a clinic | 16.7% | 69.1% | 1.1% | 13.1% |
You needed to see a doctor or nurse, but could not because of the cost | 16.6% | 69.9% | 1.9% | 11.6% |
You lacked transportation, making it difficult/prevented you from getting care | 3.7% | 82.2% | 0.9% | 13.2% |
You needed to purchase a medication, but could not because of the cost | 12.5% | 74.8% | 0.7% | 12.0% |
You needed to see a doctor or nurse, but could not because the office hours were not convenient | 13.1% | 70.8% | 2.0% | 14.0% |
A large majority of residents did not have difficulty getting to appointments, seeing a doctor or nurse, or purchasing medication (Table 2).
Water Testing:

A majority of residents have not tested there water for harmful chemicals in five years (Fig. 4). There is little difference when compared to homes that reported having children in the home (Fig. 5).


While those of lower income were slightly more likely to not have had their water tested, this is not significant. Fewer people have had their water tested. (Fig. 6).

For 10% of residents, it has been more than 5 years since their last physical checkup (Fig. 7).

65% of residents regularly go outside of the county for routine health care (Fig. 8). 73% residents have not used the community health clinics in Helena or Butte, of those 13% have never heard of these clinics (Fig. 9).


Table 3: Are you aware of what services the Jefferson County Public Health Department provides? | |
Answer Options | Response Percent |
Yes | 11% |
I know of some services, but not sure if that’s all | 44% |
No | 44% |
Only 11% of residents were aware of all services in the county health department compared to 44% that are not aware at all (Table 3).
Most residents are prepared emergency situations such as fires, but about half are unprepared in case of a carbon monoxide leak (Fig.10).


Most residents volunteer their time for community service (Fig. 11) and spend quality time with their family often (Fig. 12).


 |
| Families with children tend to spend even more quality time together (Fig. 13). |
 |
| Excluding resident that are not raising a family, about 77% are proud to raise or have raised a family here (Fig. 14) |
 |
| Most residents do not have children unsupervised during non-school hours (Fig. 15). |
Access to Education and Exercise:

About 4 out of 5 residents would like to attend local classes, of which most would like to take arts and crafts classes (Fig. 16). There is no clear trend between interest in classes and income (Fig. 17).


About 1 in 3 residents believe that are plenty of activities to get exercise. About a quarter of residents do not, another quarter don’t know (Fig. 18). Over half of residents would exercise more if walking paths were improved or added to (Fig. 19).


Regardless of income, residents state at similar levels that they would or would not exercise more if there were better, or more numerous walking paths and trials in their community (Fig. 21).


28% of resident and 57% children do not ride bikes, ATVs, or motorcycles (Fig. 24 & 25, respectively). While 30% of residents and 27% of kids always wear a helmet, about 86% always wear seatbelt (Fig. 26).

Mental Health:
Table 4: If you have health insurance does it cover mental services? | |
Answer Options | Response Percentage |
Yes | 57% |
No | 11% |
I don’t know | 31% |

About 11% of respondents did not have health insurance (Fig. 27). Of those that do, about 57% knew theirs covered mental health and about 11% knew theirs did not. Almost 1 in 3 respondents with health insurance did not know if they were covered for mental health services (Table 4).
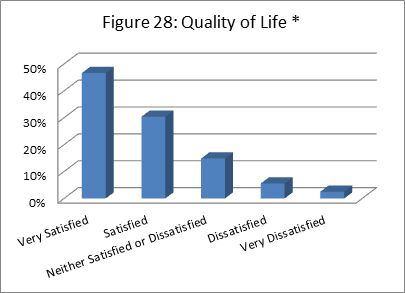
*Due to a typo in the survey half of the paper surveys were sent out with a very satisfied-very satisfied score. Some respondents corrected this, while others did not notice the mistake. We left out any ambiguous answers, but due to this mistake we cannot guarantee the accuracy of this data.


Community Support:


While about half of residents feel their county and community care about them, around 20% of residents do not. More residents are uncertain if the county cares about them compared to the community, about 38% and 32%, respectively. (Fig. 33 &34)

Cancer Screening:


